Reading Images and the NTSC Grayscale Formula
Loading images, the NTSC grayscale formula, and a checkerboard. First computer vision homework done in Python instead of MATLAB.
Abstract#
This was the first assignment in an introductory computer vision course. The problems were straightforward: read and display images, convert RGB to grayscale using the NTSC luminance weights, and generate a checkerboard from scratch. I did all of it in Python with numpy and scikit-image instead of the expected MATLAB, which turned out to be its own exercise in figuring out which library handled what.
I took this course during my Master’s and the entire thing was taught in MATLAB. I decided to do every assignment in Python instead (numpy, scikit-image, matplotlib). The TAs were fine with it as long as I wasn’t calling high-level library functions that did the work for me. As far as I know I was the first student to go this route.
Reading and displaying images#
In MATLAB, imread, imshow, imwrite are all built-in. In Python you need skimage.io for reading, matplotlib.pyplot for display, and numpy for everything else. First time sitting down to do this I spent a while figuring out which package had what.
from skimage.io import imread
from skimage.color import rgb2gray
import numpy as np
from matplotlib import pyplot as pltThe first problem was “use the MATLAB image functions to read, display, and write images.” We had two test images: buckeyes_gray.bmp and buckeyes_rgb.bmp.
grayIm = imread('buckeyes_gray.bmp')
plt.imsave('output/buckeyes_gray.jpg', grayIm, cmap=plt.get_cmap('gray'))
plt.imshow(grayIm, aspect='auto', cmap=plt.get_cmap('gray'))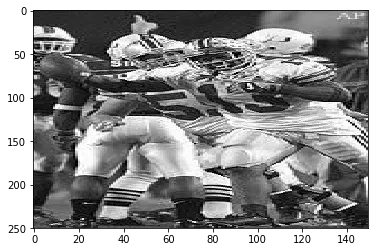
The grayscale Buckeyes image
I forgot to pass cmap='gray' to imshow on my first try. Without it, matplotlib applies viridis and everything comes out blue-green-yellow. In MATLAB imshow just knows a single-channel image is grayscale. Matplotlib doesn’t.
rgbIm = imread('buckeyes_rgb.bmp')
plt.imsave('output/buckeyes_rgb.jpg', rgbIm)
plt.imshow(rgbIm, aspect='auto')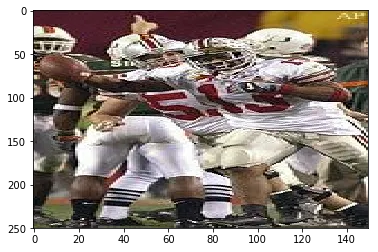
Same image, but in color
One thing about skimage.io.imread: it gives you a numpy array with dtype uint8, values 0-255. But some scikit-image functions silently convert to float64 in [0, 1]. You mix those up and your images come out all white or all black. I spent 20 minutes staring at my code before I realized this.
RGB to grayscale with the NTSC formula#
The assignment asked us to convert the color image to grayscale using the NTSC formula:
Those weights are from the NTSC standard (Rec. 601). The human eye has three types of cone cells, and our sensitivity peaks in green, so green gets the biggest weight at 0.587. Blue is the smallest at 0.114. We’re bad at perceiving blue intensity. A bright blue and a dim blue look more similar to us than a bright green and a dim green do.
If you average the three channels equally (), blues come out too bright and greens too dark. The weighted version matches what your eyes would tell you the brightness is.
grayIm_converted = rgb2gray(rgbIm)
plt.imsave('output/buckeyes_gray_converted.bmp',
           grayIm_converted, cmap=plt.get_cmap('gray'))
plt.imshow(grayIm_converted, aspect='auto', cmap=plt.get_cmap('gray'))
RGB image after grayscale conversion with the NTSC weights
The dtype issue again: rgb2gray returns float64 in [0, 1], not uint8. If you try to subtract this result from the original grayscale BMP to compare them, you get garbage until you rescale.
Building a checkerboard#
Last problem: create a checkerboard image from scratch, save it, read it back.
zBlock = np.zeros((10, 10))
oBlock = np.ones((10, 10)) * 255

pattern = np.block([[zBlock, oBlock],
                    [oBlock, zBlock]])

checkerIm = np.tile(pattern, (5, 5))

plt.imsave('output/checker.bmp', checkerIm, cmap=plt.get_cmap('gray'))
plt.imshow(checkerIm, aspect='auto', cmap=plt.get_cmap('gray'))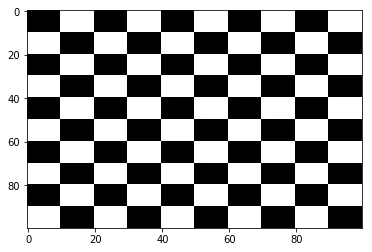
100x100 checkerboard, built from 10x10 pixel squares
np.block takes a nested list that mirrors the layout you want. [[black, white], [white, black]] gives you a 20x20 pattern, then np.tile(pattern, (5, 5)) repeats that 5 times in each direction. MATLAB has [A B; C D] for the same thing, which is more compact. The nested list is more readable though.
Wrap up#
This was a “make sure your environment works” assignment. The NTSC formula was the only real content. I’d never thought about why grayscale conversion uses unequal weights before, and the perceptual sensitivity explanation made sense. The dtype issue between uint8 and float64 was annoying but at least I hit it now instead of later.